
By María Carolina Quintana Noriega
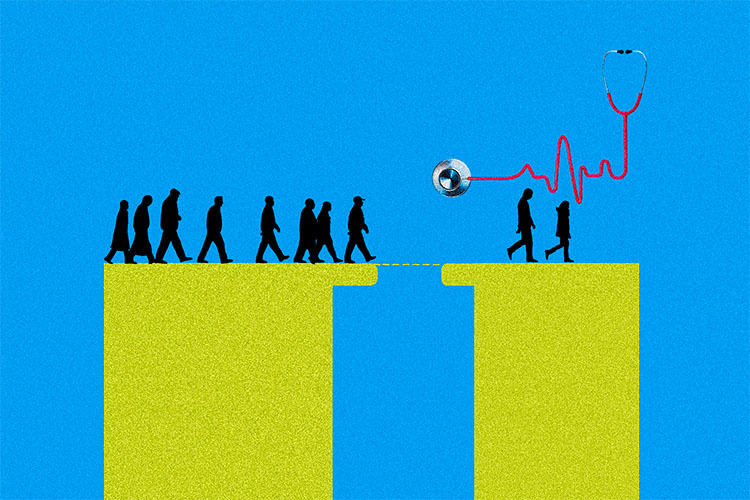
Disparities in public health infrastructure across Mexico City reveal a stark reality: hospitals and clinics are unevenly distributed, disproportionately affecting residents who live on the city’s outskirts. This article examines the issue and provides an analysis to understand what is happening—and how these inequalities can be addressed.
The study “Implementation of Spatial Correlations and Kernel Densities to Identify Deficiencies in the Coverage of Public Health Infrastructure” analyzed the concentration patterns of active COVID-19 cases in areas with lower hospital coverage.
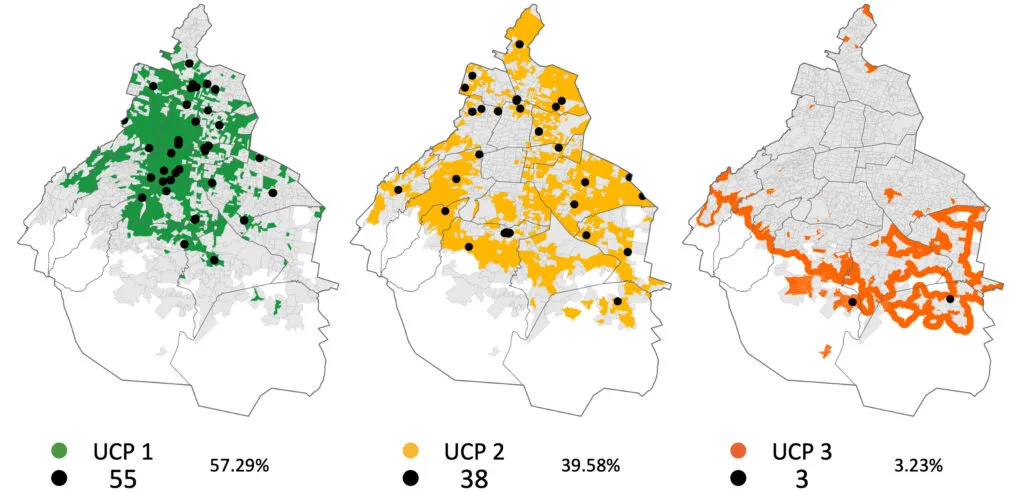
The findings show that within the first urban containment perimeter—the city’s consolidated central zone—57.29% of public health facilities are located. The second perimeter holds 39.58%, while the third, on the periphery, has just 3.23%
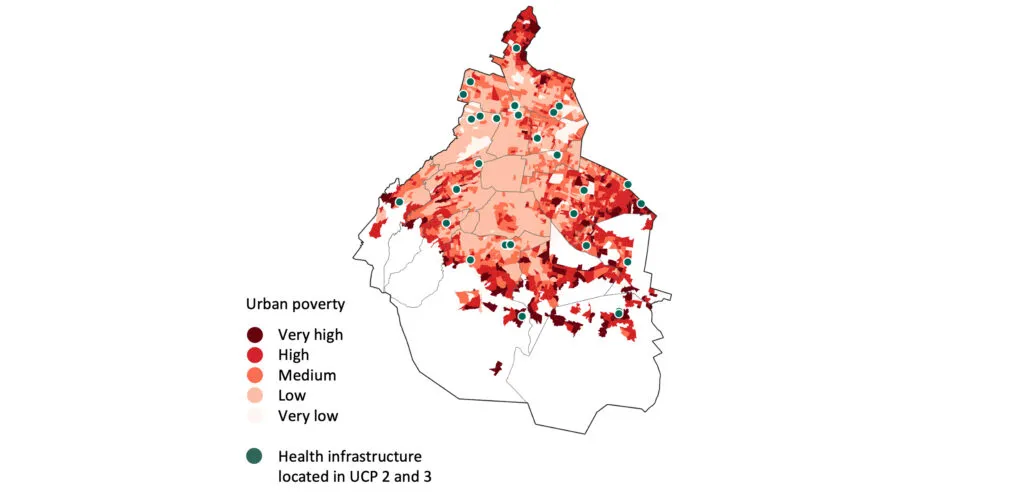
When these data are compared with poverty indicators, a clear correlation emerges between the placement of health facilities and areas with higher levels of urban poverty. Peripheral zones lack not only health services, but also other basic urban amenities, further worsening living conditions for their residents.
The pandemic as a mirror of inequality
The analysis reveals a linear correlation between saturated hospitals and COVID-19 cases in the central and northern parts of the city. Heat maps—generated according to hospital capacity—highlighted critical areas of saturation and available capacity.
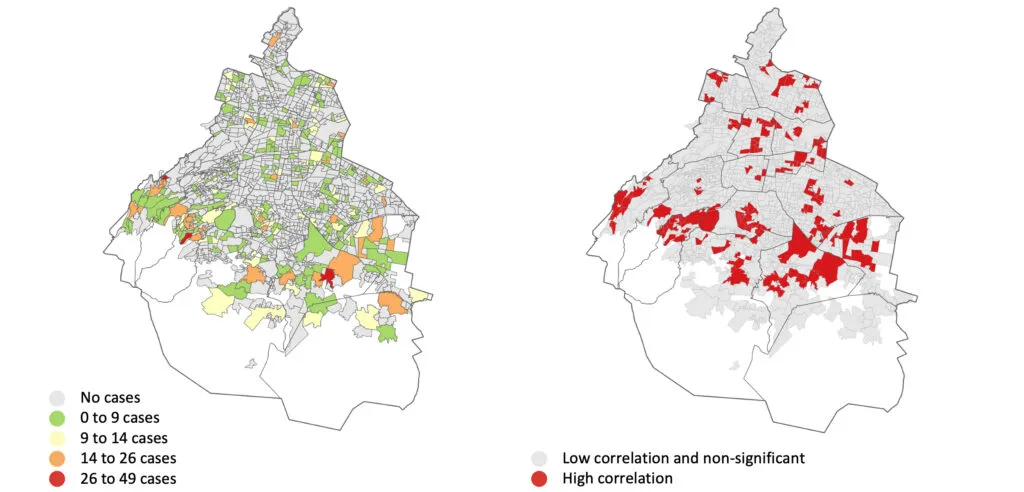
Using daily active-case data by neighborhood from the Respiratory Disease Surveillance System (SINAVE) of the Ministry of Health, researchers identified clusters of neighborhoods with a significantly higher proportion of active cases.
Because SARS-CoV-2 spreads directly among people, an analysis based on active cases is especially relevant: it allows researchers to pinpoint the most significant clusters of urban areas experiencing infections—not simply transmission events.
This same correlation-based approach can help pinpoint priority areas for healthcare, not just during a pandemic but also for long-term urban planning of health infrastructure.
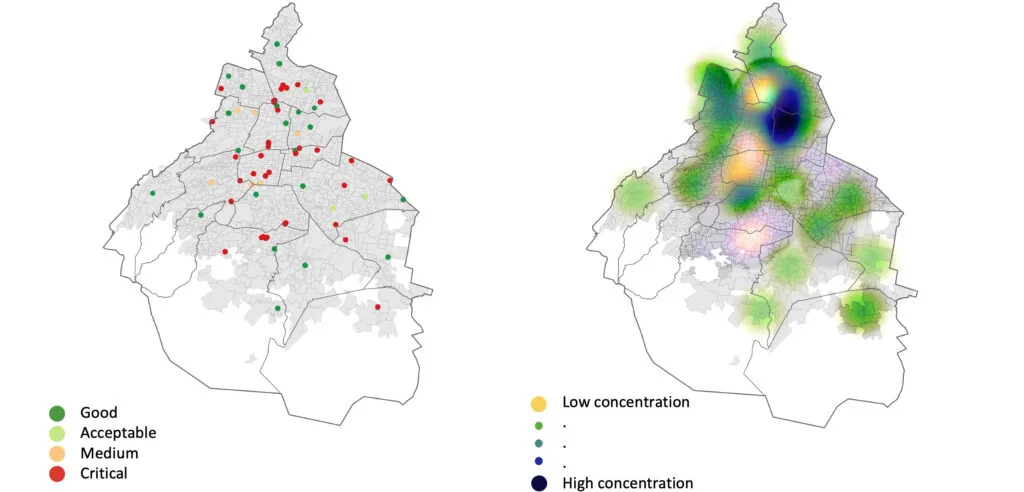
After identifying these clustering patterns, the study located public health facilities and examined the capacity of their intensive care units.
This mapping exercise showed a linear correlation between hospitals whose ICUs were saturated and neighborhoods with high numbers of active COVID-19 cases. To evaluate the severity of this saturation, researchers created heat maps based on ICU capacity.
Visualizing this data pinpoints areas with saturated hospital capacity, areas with available capacity, and clusters of health facilities that—despite operating at critical levels—handle the majority of care across the city.
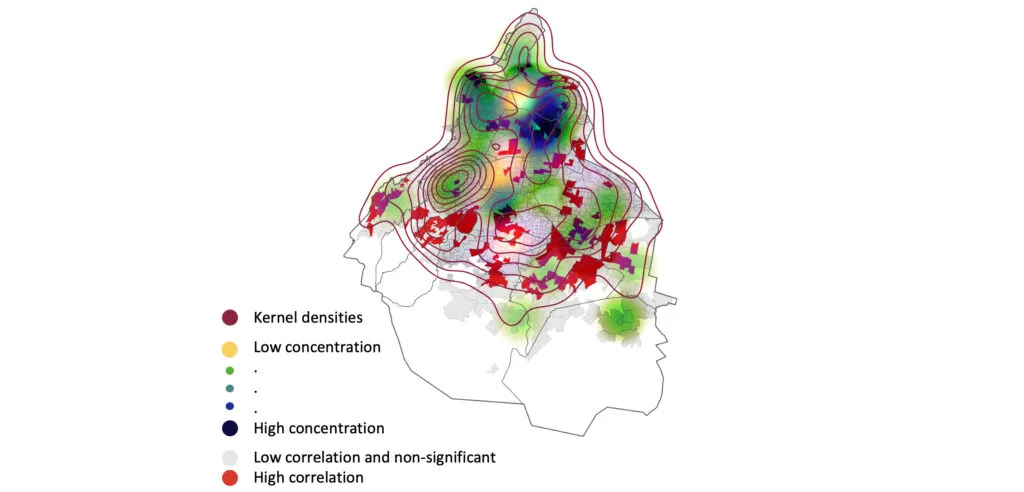
When this territorial trend is compared to the distribution of neighborhood-level active-case correlations, the two patterns appear to be almost negatively correlated.
The geography behind health inequity
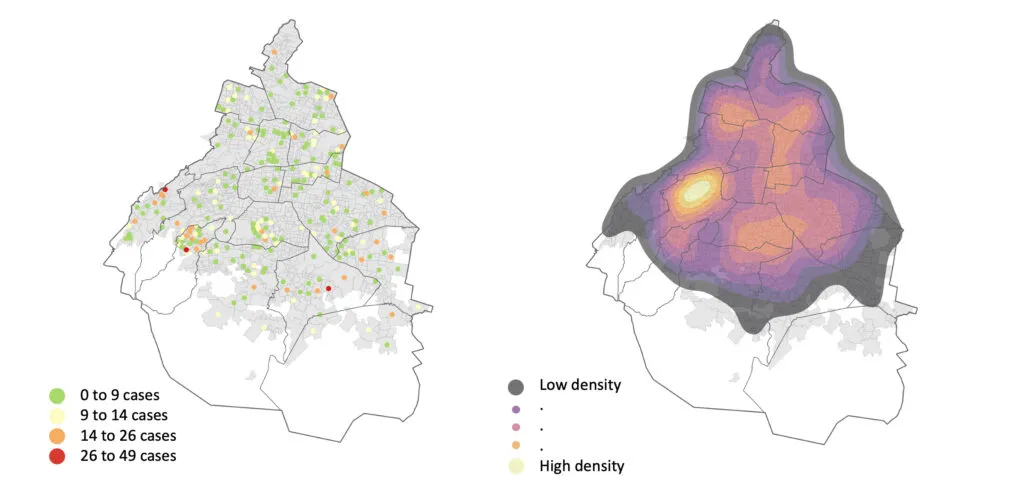
To verify this observation, researchers created density maps using the centroid—the geographic center—of daily active COVID-19 cases by neighborhood in Mexico City. The geospatial analysis reveals clear territorial segregation in areas with the highest concentration of cases.
This cartographic representation shows that the reference points with the highest numbers of active infections do not form a territorial cluster; instead, they reflect segregation.
This geographic pattern—where active cases are segregated not only from areas with fewer cases but also from the city’s main health-care hubs—suggests a real lack of coverage and limited accessibility to health services in the affected areas.
A Map That Exposes Inequality
The study concludes that the perceived shortage of health facilities in Mexico City’s peripheral areas is not just a perception—it is a measurable, verified reality.
The methodology demonstrates the importance of integrating this type of analysis into urban planning to promote more inclusive settlements and ensure that health services are accessible to all. Policies informed by these findings could significantly improve living conditions in Latin American cities.
It is also important to note that applying geographic information systems to urban planning makes the invisible visible—and improves what can be measured.
Ultimately, the study confirms that the perceived lack of health facilities in the city’s outskirts, particularly in irregular settlement areas, stems from a real deficiency in where these facilities are located.
Reference
Quintana Noriega, M.C. (2025). Implementation of Spatial Correlations and Kernel Densities to Identify Deficiencies in the Coverage of Public Health Infrastructure. In: Mata-Rivera, M.F., Zagal-Flores, R., Elisabeth Ballari, D., León-Borges, J.A. (eds) Geographical Information Systems. GIS-LATAM 2024. Communications in Computer and Information Science, vol 2298. Springer, Cham
Author
María Carolina Quintana Noriega. Assistant research professor at the School of Architecture, Art, and Design at Tecnológico de Monterrey. Her work focuses on geo-statistical analysis with an emphasis on land-use planning from a socio-spatial perspective, as well as research on poverty and socio-territorial inequalities, patterns of urban space occupation by ethno-religious groups, and the distribution of ecosystem resources across territories.