

We still don’t have time machines to predict the future. In the meantime, what we do have are statistical models that allow us to simulate scenarios that help planners anticipate challenges and prevent costly mistakes.
That’s what Roberto Ponce, professor-researcher at the School of Government and Public Transformation (EGobiernoyTP) at Tec de Monterrey and leader of the project at the Center for the Future of Cities, is doing in Mexicali alongside his colleagues. There, they’re generating computational models to imagine the future of this border city.

What Is Computational Urbanism?
Statistical modeling has long been used for years to create weather forecasts or, in fields like geography, to model the behavior of phenomena such as volcanic eruptions and define the most appropriate evacuation routes. But in Mexico, the use of these models for city planning is relatively new.
Unlike traditional urbanism, computational urbanism uses large, quantitative datasets to model future urban scenarios. This way, before building, for example, a housing development, you can predict—with a certain degree of uncertainty—how successful the project will be.
For Ponce, these tools are especially relevant due to the scale of the cities we inhabit:
“Cities are more complex systems. Take transportation. Before, you went from your house to work downtown, and that was it. Now people have to make more complex trips. We live in a multimodal transportation system, including shared bikes, ride-hailing services like Uber, and taxis. In housing too, everyone used to live downtown, and now there’s a whole variety of polycentric cities,” explains the political scientist.
Ciudad Borde: A Data-Driven Model for Mexicali’s Future
The Center for the Future of Cities’ efforts began in Monterrey with the Ciudad Finita project, where they warn about the metropolis’s limited resources. Now, this same team is working in Mexicali thanks to interest from the private sector in this city.
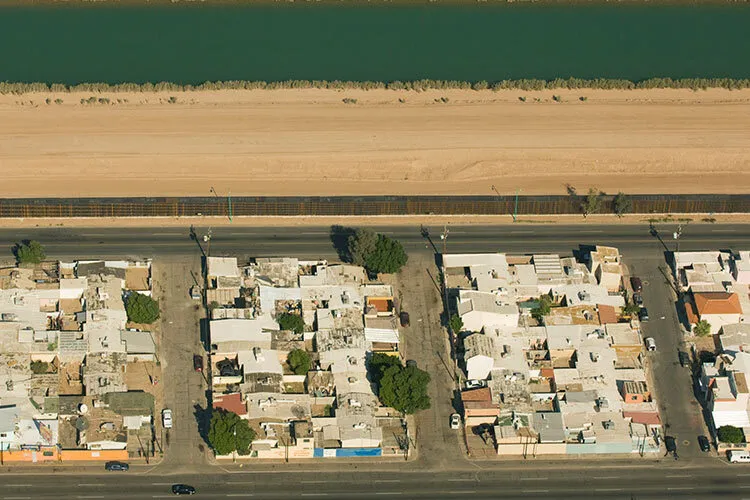
The first thing they decided to do was create a tool to help explain what the planning problems in Mexicali were. For this, they created the Ciudad Borde platform, with a set of historical data about why this metropolis is the way it is. For example, how the invisible divide between the lower-income east and the more affluent west came to define the city’s urban landscape.
Additionally, Ciudad Borde includes a set of maps and visualizations that reveal problems such as the displacement of housing to the city’s outskirts, leaving the center uninhabited. Meanwhile, in terms of mobility, they found that only between 6 and 7% of trips within the city are made by public transit. As for the environment, they found elevated temperatures, poor air quality, and barely 2.4 square meters of green space per person, well below the 9 square meters recommended by the World Health Organization (WHO).
To conduct this diagnosis, the team combined multiple public and private data sources. For example, to count the number of trees in Mexicali, they downloaded Google Street View images from within the city and, with the help of an algorithm, identified where green areas were located.
On the other hand, to identify people’s movements, they used cell phone location data from Mexicali residents. This data is commercialized by companies like Echo Analytics and Veraset for marketing purposes but was used by Ponce and his team for their research.
Simulating to Decide: Affordable Housing and Downtown Revitalization
In addition to creating Ciudad Borde to help publicize the problems faced by Mexicali’s residents, they decided to develop a proposal for how to solve some of these dilemmas.
Based on variables such as the number and size of vacant lots, they ran simulations to identify where it would be most viable to create an affordable housing program that would repopulate downtown. Ponce explains that this strategy of bringing people back to this area is important, since it’s in that area where most of the infrastructure that enables a dignified life is located, such as water and drainage.
What they found is that a corridor that connects Pueblo Nuevo with Álvaro Obregón Avenue would be the ideal location for a project of this type.
“For the municipal administration, the Pueblo Nuevo area was very important, as it’s more marginalized. And the idea of connecting them in the same project is also a bit about breaking this history of Mexicali being a city split in two: east and west,” Ponce explains.
Although the researcher admits that several more years of effort and resources are still needed to make that project a reality, he considers it progress that the groundwork is being laid with a pilot project coordinated by his team and updating zoning regulations to make the project feasible.
Imagining the future with data and citizen participation
Time machines may not exist—but data-driven urban modeling already offers a powerful way to shape Mexicali’s future.
In the final chapter of Ciudad Borde, at least 1,500 participants expressed what they think their city should be like. There, what’s highlighted most is a desire for more green spaces and safety. In that same section, there’s a map of what this border city would look like if there were seven square meters of vegetation per person.
Did you find this story interesting? Would you like to publish it? Contact our content editor to learn more at marianaleonm@tec.mx