

With climate change, the intensity and frequency of heat waves have increased globally, but their impacts are greater in certain areas. In a recent study, a multidisciplinary and international team of researchers developed an index that identifies the most vulnerable regions.
Developed from open data, the Global Urban Heat Vulnerability Index (GUHVI) not only identifies where it is hotter, but also where that heat poses the greatest danger to the population.
Unlike many other indexes, this one allows for comparison of results between different cities around the world. “That doesn’t mean they don’t need to be contextualized; all cities are different,” explains one of the authors, Eugen Resendiz, who is also a fellow at the Center for the Future of Cities and a research professor at the School of Architecture, Art and Design (EAAD) of Tec de Monterrey.
The GUHVI is based on the conceptual framework of the Intergovernmental Panel on Climate Change (IPCC) which defines vulnerability based on three components: exposure, sensitivity and adaptive capacity.
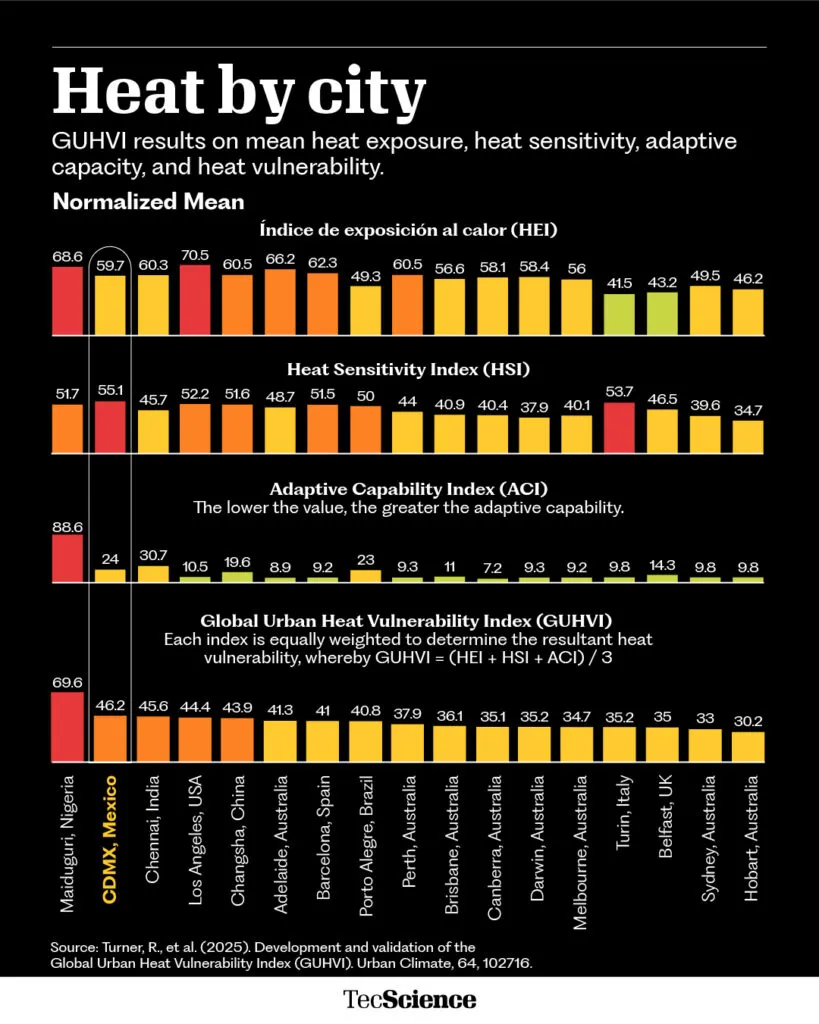
Based on this approach, the index is constructed from three sub-indexes:
- Heat Exposure Index: measures heat through the surface temperature of the ground.
- Heat Sensitivity Index: incorporates urban variables such as population density, vegetation and percentage of solar radiation reflection.
- Adaptive Capability Index: includes socioeconomic indicators such as infant mortality and access to health services.
In total, this model integrates ten variables and gives them equal weight, so each component contributes equally to the final result. The data comes from global and satellite sources, allowing it to be applied everywhere, even in cities where detailed local statistics are unavailable.
From a Local Model to a Global Tool
Originally, the index was designed for it to be used in Sydney, Australia, by Ryan Turner, then a PhD student at the Centre for Urban Research at the Royal Melbourne Institute of Technology (RMIT University).
Subsequently, a team made up of researchers from Mexico, Australia, China, the United States, Italy, Spain, the United Kingdom, Brazil and New Zealand —all members of the Global Observatory of Healthy and Sustainable Cities— adapted it to transform it into a comparable tool on a global scale.
The result is expressed on a scale from zero to one hundred, and the higher the value, the greater the impact will be on people’s health in the face of an extreme heat event.
“Other indexes, such as the heat exposure index, although informative, ignore how people are distributed in that urban environment,” explains Gonzalo Peraza, research professor at the Center for the Future of Cities and the School of Government and Public Transformation (EGobiernoyTP) and another one of the authors of the article.
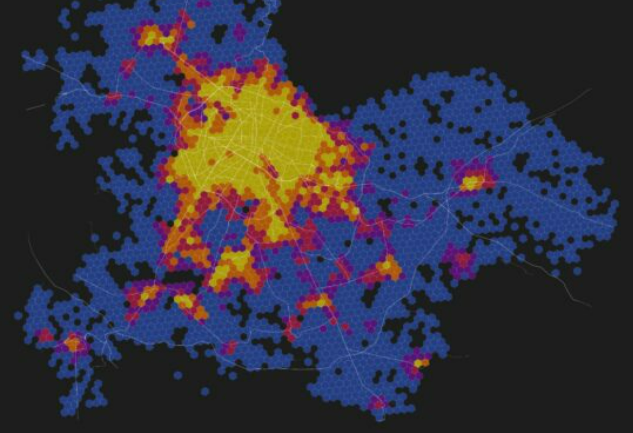
One of the main innovations of the index is its spatial resolution, which is calculated in cells of one square kilometer, making it possible to identify differences in vulnerability levels within the same city.
“The idea is to apply it to the entire metropolitan area and then zoom in on the regions that interest you to identify the more or less vulnerable ones,” says Peraza.
Mexico City, the Second Most Vulnerable
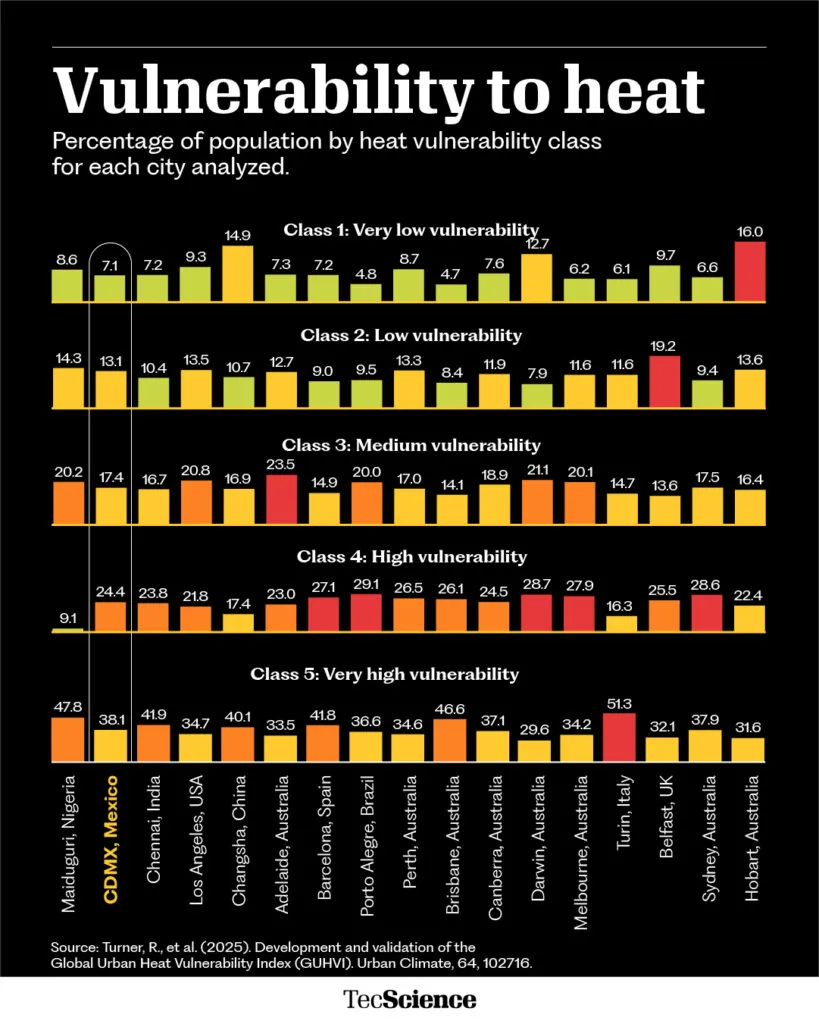
When researchers applied the index to cities around the world, they found a pattern: most of the population is concentrated in areas that are most vulnerable to heat. This suggests that the risk is not only high but also widely distributed in urban environments.
These areas are usually densely populated, with little vegetation cover, large areas built with impermeable materials —which do not allow water to filter through— high temperatures and adverse socioeconomic conditions.
“It was very interesting to see that 60% of the population of the Mexico City metropolitan area lives in areas that are highly vulnerable to heat,” Resendiz points out.
In total, the study analyzed seventeen cities. Maiduguri, Nigeria, has the highest level of vulnerability, with a score of 69.6, followed by Mexico City with 46.2. Hobart, Australia, has the lowest score at 30.2.
These results show that vulnerability does not depend solely on income level, as wealthy cities, such as Los Angeles, can exhibit high levels due to their exposure to heat.
The case of the Mexican capital illustrates this well: although its exposure is less than that of Los Angeles, its high urban sensitivity and low adaptive capacity increase its overall vulnerability.
Taken together, the results confirm that the risk from extreme heat is not determined by a single factor, but by the interaction between environmental, urban, and social conditions.
A Tool for Decision Making
In addition to it being a great tool for diagnosing the most vulnerable areas to extreme heat, the GUHVI can be used for the design of public policies aimed at climate adaptation.
Mapping vulnerability at the neighborhood scale allows for precise identification of where to intervene and what factors to modify.
This is essential for places like Mexico, where extreme heat already poses a growing risk to public health. Every year, hundreds of cases and dozens or even hundreds of deaths are recorded due to extreme temperatures, primarily from heatstroke and dehydration.
“What it allows you to do is prioritize interventions,” Peraza explains. “States have a finite amount of resources and want to maximize their use, so the question is, where am I going to intervene to have the greatest impact?”
The study suggests that actions such as increasing vegetation cover, reducing impermeable surfaces, expanding access to health services in vulnerable areas, and improving the thermal efficiency of homes can reduce this danger.
It also opens the door to policies focused on particularly vulnerable groups. “Children under five and adults over 65 are populations much more susceptible to heat and other effects of climate change,” Resendiz emphasizes.
Furthermore, as a global index, it allows for the comparison between cities and the identification of good practices that can then be adapted to each context.
In a scenario where extreme heat will become increasingly frequent, tools like the GUHVI offer the necessary evidence to anticipate risks and build more resilient cities.
“Heat is here to stay,” Resendiz concludes. “We need to start taking action, researching, and better understanding what’s happening.”
Did you find this story interesting? Would you like to publish it? Contact our content editor to learn more: marianaleonm@tec.mx